
Most product teams can state their goal. Increase activation, reduce churn, grow revenue per account. The hard part is not knowing the outcome but knowing what to do about it. An opportunity solution tree closes that gap.
Without one, teams fill the space with opinions, stakeholder requests, and whatever a competitor just launched. Features ship. Metrics do not move.
Teresa Torres created the opportunity solution tree as part of her continuous discovery framework. The tree maps the space between a desired outcome and the experiments that test whether a solution will work. Rather than a project plan, the tool makes the hidden thinking between ‘we want X’ and ‘let’s build Y’ visible and open to debate.
What an opportunity solution tree is
An opportunity solution tree has four layers. At the top sits a single desired outcome, a measurable change in user or business behaviour. Below it sit opportunities, the unmet needs and pain points that user research has surfaced. Below those sit solutions, the product changes that might address one or more opportunities. At the bottom sit assumption tests, the smallest experiments that check whether a solution will work.
The tree reads top to bottom. Every solution must trace back to an opportunity. Every opportunity must connect to the outcome. If a solution has no link to a researched opportunity, it is a guess dressed as a plan.
This structure does three things that a flat backlog cannot. It forces the team to say why a solution matters, not just what it is. It makes trade-offs visible, because two solutions for the same need are easier to compare than two items in a ranked list. And it keeps problems apart from solutions, which stops the team falling in love with an idea before grasping the problem it solves.
The tree is not a deliverable, a backlog replacement, or a one-off workshop output. It is not something you produce once and hand to stakeholders. It is a living artefact that changes as the team learns. If the tree looks the same after two weeks of discovery, something has gone wrong.
Where teams go wrong with opportunity solution trees
The most common mistake is treating the tree as a brainstorming exercise. A team sits in a room, generates opportunities from memory, attaches solutions, and declares the tree complete. This misses the point. Opportunities should come from user research, not from the team’s guesses about what users need.
As Marty Cagan argues, discovery is about separating good ideas from bad ones before committing to build. An opportunity solution tree built without talking to users is just a feature list with extra steps.
Keeping the tree focussed
The second mistake is letting the tree grow too wide. In practice, three to five opportunities under a single outcome is a useful upper bound. More than that and the team cannot focus.
Each opportunity should be specific enough to suggest a direction. ‘Users find onboarding confusing’ is too broad. ‘Users abandon the setup wizard at step three because they do not understand what data to import’ is specific enough to act on.
A third problem is skipping the assumption layer. Teams identify an opportunity, generate a solution, and start building. The assumption test exists to prevent exactly this.
Before committing engineering effort, the team should name the riskiest assumption behind the solution and design the smallest test that could prove it wrong. If the assumption fails, the team learns cheaply. If they skip this step, they learn the hard way, after shipping.
The final common error is choosing an outcome that is not measurable. ‘Improve the user experience’ is not an outcome. It is a wish. An outcome must be a metric the team can track week to week, such as ‘raise 30-day activation from 35% to 50%’.
Without a number, there is no way to know whether the tree is working. Choosing the right metric matters enough that it deserves its own treatment, covered in this guide to data-driven product management.
A worked example from retention metric to experiment
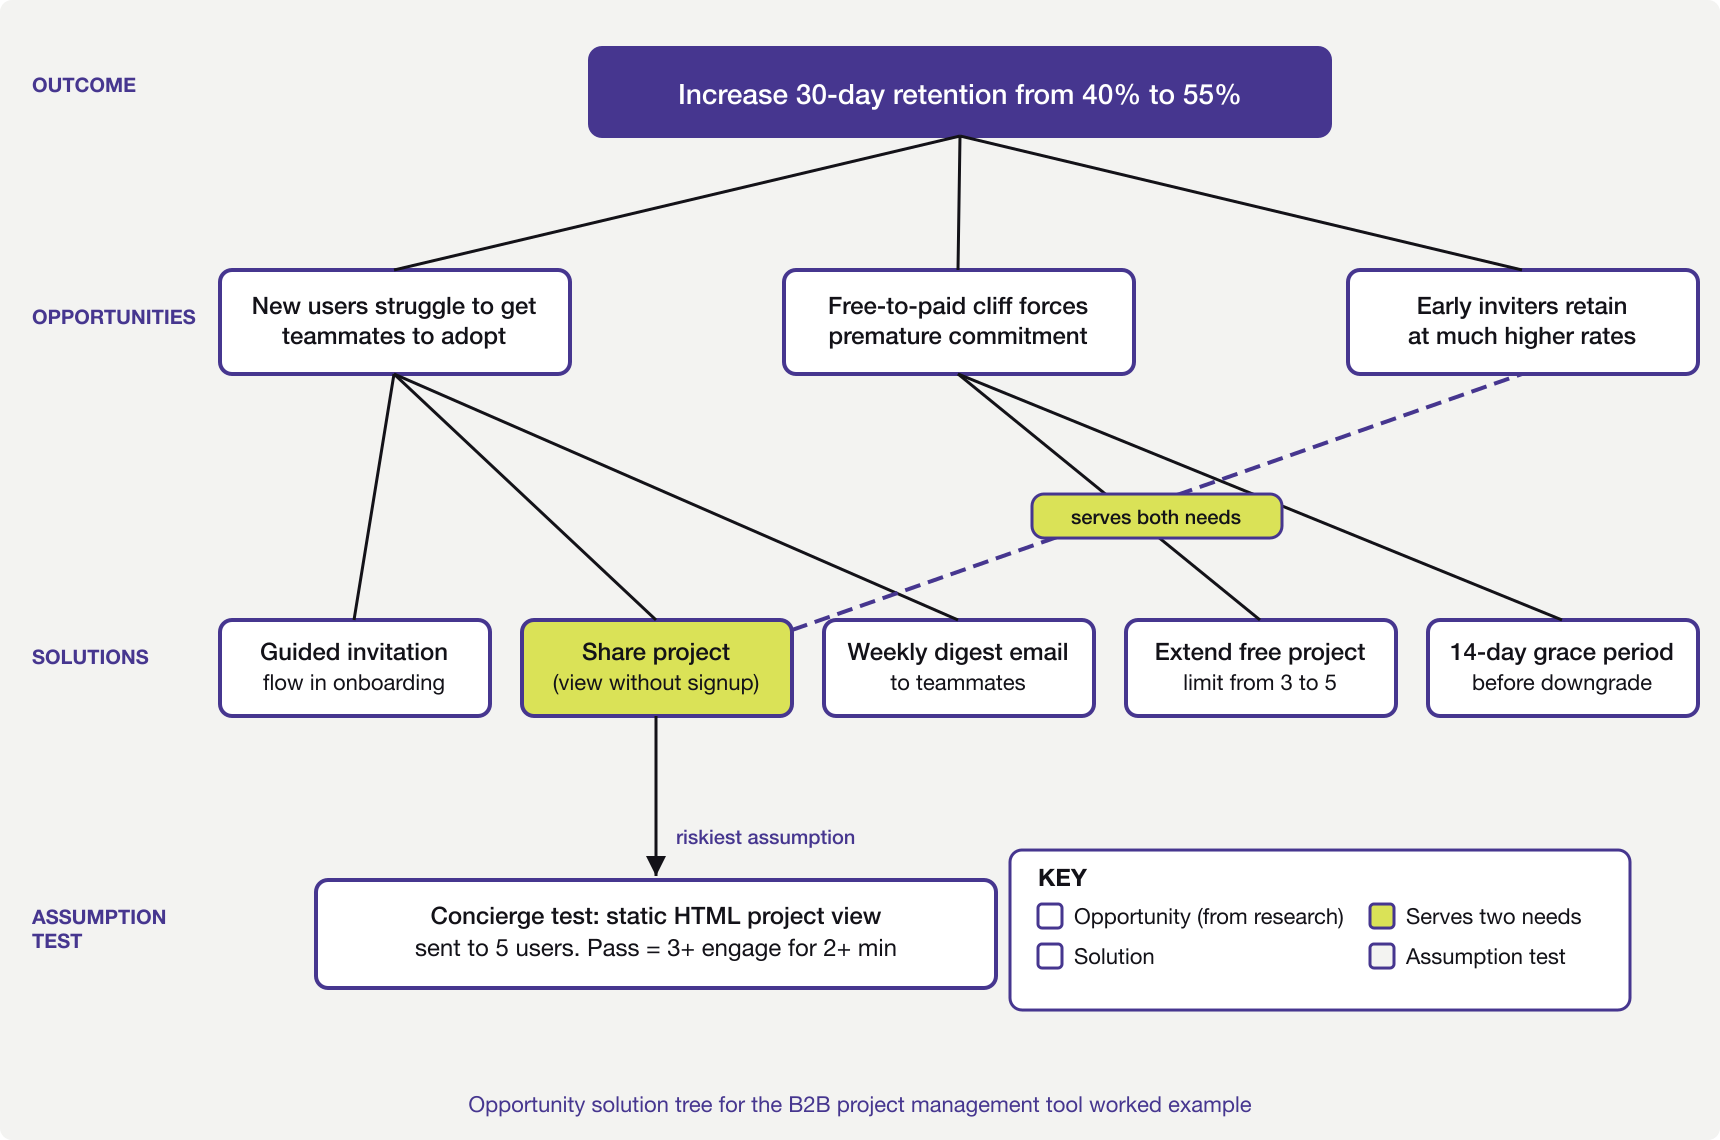
Consider a B2B project management tool where 30-day retention sits at 40%. The product team has been told to improve it. The temptation is to jump straight to solutions. Add a mobile app, redesign the dashboard, build integrations.
An opportunity solution tree forces the team to ask why users leave before deciding what to build.
Setting the outcome
The outcome goes at the top of the tree. In this case, increase 30-day retention from 40% to 55%. Specific enough to measure, close enough to the team’s work that they will know within six to eight weeks whether it is moving.
A common trap here is picking an outcome too far from the team’s influence. ‘Increase annual revenue by 20%’ is a company goal, not a product outcome. The team cannot draw a direct line from their work to that number. Retention is closer to something the product team can affect.
Mapping opportunities from research
The team interviews twelve recently churned users and five who stayed past 60 days. Three patterns emerge from the interviews.
Churned users report that they could not get their team to adopt the tool. They set it up, added a project, but colleagues kept using email and spreadsheets. The tool became a personal task list rather than a team workspace.
A second group say they hit a wall after the trial ended. The free tier limited them to three projects. By that point they had five active projects and could not justify the cost for a tool only they were using.
Retained users describe a different experience. They invited teammates in the first week. Those teammates created their own projects. The tool became a shared workspace quickly enough that removing it would have been disruptive.
Three opportunities go onto the tree. New users struggle to get teammates to adopt the tool. The free-to-paid transition creates a cliff that forces premature commitment. And users who invite teammates early retain at much higher rates.
That third point echoes the activation patterns seen in product-led growth, where free users become distribution when collaboration loops exist.
Generating solutions and spotting overlaps
For the first opportunity (team adoption struggle), the team generates three possible solutions. A guided team invitation flow during onboarding. A ‘share this project’ feature that lets non-users view and comment without signing up. And a weekly digest email showing teammates what was updated.
For the second opportunity (free tier cliff), two solutions emerge. Extending the project limit on the free tier from three to five. Or offering a 14-day grace period where users can keep all projects while they decide whether to upgrade.
Something useful happens here. The ‘share this project’ solution for the first opportunity also helps with the third (early teammate invitation). It lowers the barrier for teammates to see value without signing up. This overlap is what the tree is built to surface. A solution that serves two needs is worth more than one that serves only one, and the tree makes that visible in a way a flat backlog cannot.
Testing assumptions before building
The team decides to pursue the ‘share this project’ solution first because it serves two opportunities. Before building anything, they identify the riskiest assumption. Will non-users actually engage with a shared project view, or will they ignore the invitation?
The assumption test is a concierge test. The team sends five existing users a link to a read-only project view, built as a static HTML page rather than a real feature. They track whether the recipients open it, how long they spend, and whether any ask about signing up.
If three of the five recipients engage for more than two minutes, the evidence is thin but real. If none engage, the assumption is wrong and the team moves on without having written a line of production code.
This is where the opportunity solution tree earns its value. Without it, the team would have debated the feature in a roadmap meeting, estimated it at six weeks of work, and either built it on faith or shelved it. The tree forced them to test the riskiest part first, cheaply.
When the tree needs restructuring
The tree will change. This is the point. After the concierge test, the team might learn that non-users do engage with shared views but only when the sharer adds a personal message. That changes the solution from ‘share this project’ to ‘share this project with a prompted personal note’. The tree updates to reflect this.
More importantly, the outcome itself might need revisiting. If the team finds that 30-day retention is a symptom of poor activation, the outcome should shift to ‘increase week-one activation rate’. The tree restructures around the new goal. Old opportunities get re-evaluated. Some drop off entirely.
This is not failure. A tree that restructures in response to learning is working as intended. A tree that stays static is decorative. The whole purpose is to make the team’s thinking explicit so that new facts have somewhere to land. When research contradicts an assumption, the tree shows which branch is affected and what needs rethinking.
Quick reference checklist
- The outcome at the top is a specific, measurable metric the team tracks weekly.
- Opportunities come from user research, not from team brainstorming alone.
- No more than three to five active opportunities sit under the outcome at once.
- Each opportunity is specific enough to suggest a direction for solutions.
- Every solution traces back to at least one researched opportunity.
- The riskiest assumption behind each solution is named before building starts.
- Each assumption test targets a single assumption and can run in under a week.
- The tree has changed in the last two weeks based on new learning.
The opportunity solution tree does not make product decisions easier. It makes the reasoning behind them visible. That visibility turns hunches into testable bets and roadmaps into something a team can defend with evidence rather than opinion.
A reasonable starting point is to pick one outcome your team is pursuing this quarter and list the opportunities that user research has surfaced for it. Two layers of the tree, written on a whiteboard, are enough to show whether the thinking holds up.